
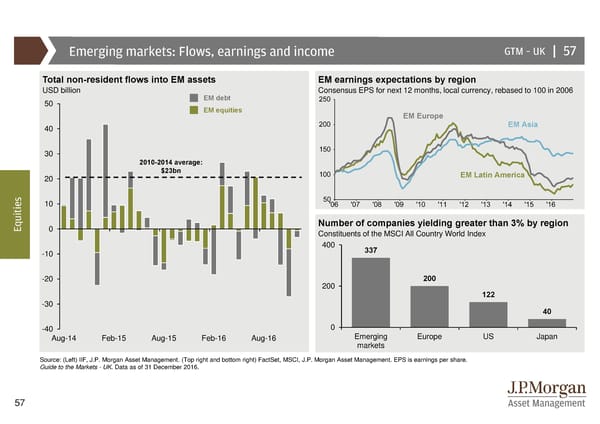
Emerging markets: Flows, earnings and income GTM –UK | 57 Total non-resident flows into EM assets EM earnings expectations by region USD billion Consensus EPS for next 12 months, local currency, rebased to 100 in 2006 50 EM debt EM equities EM Europe 40 EM Asia 30 2010-2014 average: 20 $23bn EM Latin America s 10 e i t i u Number of companies yielding greater than 3% by region Eq 0 Constituents of the MSCI All Country World Index 400 337 -10 -20 200 200 122 -30 40 -40 0 Aug-14 Feb-15 Aug-15 Feb-16 Aug-16 Emerging Europe US Japan markets Source: (Left) IIF, J.P. Morgan Asset Management. (Top right and bottom right) FactSet, MSCI, J.P. Morgan Asset Management. EPS is earnings per share. Guide to the Markets - UK. Data as of 31 December 2016. 57
 Guide to the Markets Page 56 Page 58