
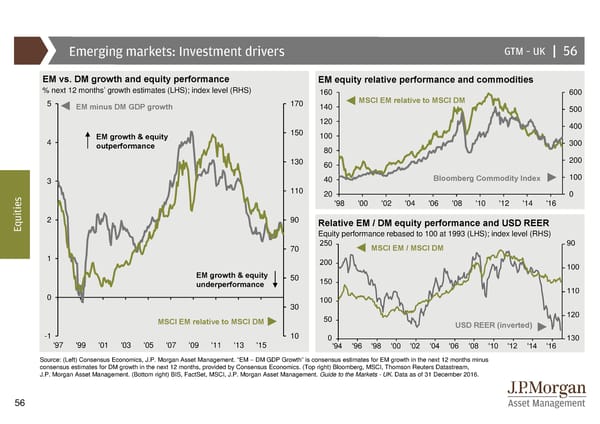
Emerging markets: Investment drivers GTM –UK | 56 EM vs. DM growth and equity performance EM equity relative performance and commodities % next 12 months’ growth estimates (LHS); index level (RHS) 160 600 5 EM minus DM GDP growth 170 140 MSCI EM relative to MSCI DM 500 120 400 EM growth & equity 150 100 4 outperformance 300 80 130 60 200 3 40 Bloomberg Commodity Index 100 s 110 20 0 e '98 '00 '02 '04 '06 '08 '10 '12 '14 '16 i t i u 2 90 Relative EM / DM equity performance and USD REER Eq Equity performance rebased to 100 at 1993 (LHS); index level (RHS) 70 MSCI EM / MSCI DM 1 EM growth & equity 50 underperformance 0 30 MSCI EM relative to MSCI DM USD REER (inverted) -1 10 '97 '99 '01 '03 '05 '07 '09 '11 '13 '15 Source: (Left) Consensus Economics, J.P. Morgan Asset Management. “EM – DM GDP Growth” is consensus estimates for EM growth in the next 12 months minus consensus estimates for DM growth in the next 12 months, provided by Consensus Economics. (Top right) Bloomberg, MSCI, Thomson Reuters Datastream, J.P. Morgan Asset Management. (Bottom right) BIS, FactSet, MSCI, J.P. Morgan Asset Management. Guide to the Markets - UK. Data as of 31 December 2016. 56
 Guide to the Markets Page 55 Page 57