
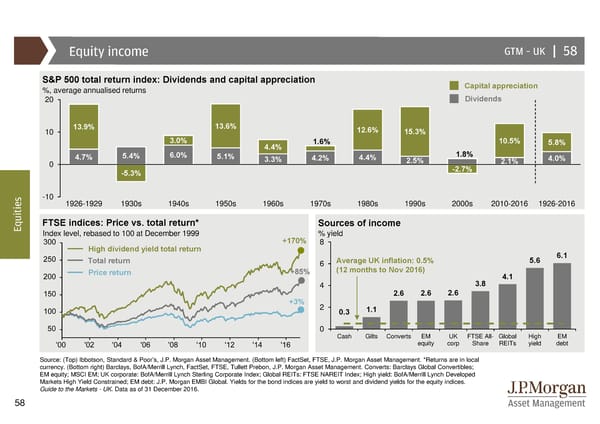
Equity income GTM –UK | 58 S&P 500 total return index: Dividends and capital appreciation Capital appreciation %, average annualised returns 20 Dividends 10 13.9% 13.6% 12.6% 15.3% 3.0% 4.4% 1.6% 10.5% 5.8% 4.7% 5.4% 6.0% 5.1% 3.3% 4.2% 4.4% 2.5% 1.8% 2.1% 4.0% 0 -2.7% -5.3% s -10 1926-1929 1930s 1940s 1950s 1960s 1970s 1980s 1990s 2000s 2010-2016 1926-2016 e i t i u FTSE indices: Price vs. total return* Sources of income Eq Index level, rebased to 100 at December 1999 % yield +170% 8 High dividend yield total return 6.1 Total return 6 Average UK inflation: 0.5% 5.6 Price return +85% (12 months to Nov 2016) 4.1 4 3.8 2.6 2.6 2.6 +3% 2 1.1 0.3 0 Cash Gilts Converts EM UK FTSE All- Global High EM equity corp Share REITs yield debt Source: (Top) Ibbotson, Standard & Poor’s, J.P. Morgan Asset Management. (Bottom left) FactSet, FTSE, J.P. Morgan Asset Management. *Returns are in local currency. (Bottom right) Barclays, BofA/Merrill Lynch, FactSet, FTSE, Tullett Prebon, J.P. Morgan Asset Management. Converts: Barclays Global Convertibles; EM equity; MSCI EM; UK corporate: BofA/Merrill Lynch Sterling Corporate Index; Global REITs: FTSE NAREIT Index; High yield: BofA/Merrill Lynch Developed Markets High Yield Constrained; EM debt: J.P. Morgan EMBI Global. Yields for the bond indices are yield to worst and dividend yields for the equity indices. Guide to the Markets - UK. Data as of 31 December 2016. 58
 Guide to the Markets Page 57 Page 59