
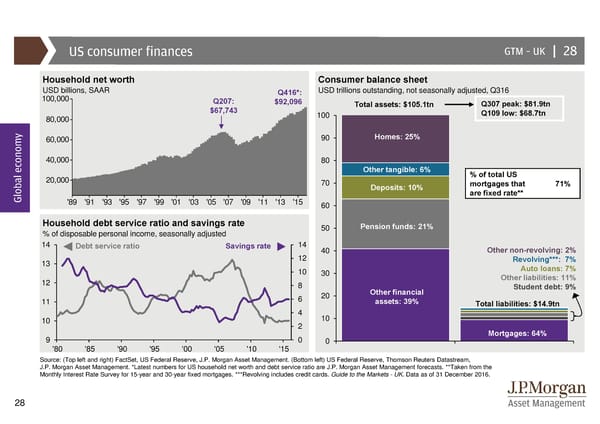
US consumer finances GTM –UK | 28 Household net worth Consumer balance sheet USD billions, SAAR Q416*: USD trillions outstanding, not seasonally adjusted, Q316 100,000 Q207: $92,096 Total assets: $105.1tn Q307 peak: $81.9tn $67,743 100 Q109 low: $68.7tn 80,000 y 60,000 90 Homes: 25% 40,000 80 Other tangible: 6% % of total US 20,000 70 mortgages that 71% Global econom Deposits: 10% are fixed rate** '89 '91 '93 '95 '97 '99 '01 '03 '05 '07 '09 '11 '13 '15 60 Household debt service ratio and savings rate 50 Pension funds: 21% % of disposable personal income, seasonally adjusted 14 Debt service ratio Savings rate 14 40 Other non-revolving: 2% 13 12 Revolving***: 7% 10 30 Auto loans: 7% 12 8 Other liabilities: 11% Other financial Student debt: 9% 11 6 20 assets: 39% Total liabilities: $14.9tn 4 10 10 2 9 0 0 Mortgages: 64% '80 '85 '90 '95 '00 '05 '10 '15 Source: (Top left and right) FactSet, US Federal Reserve, J.P. Morgan Asset Management. (Bottom left) US Federal Reserve, Thomson Reuters Datastream, J.P. Morgan Asset Management. *Latest numbers for US household net worth and debt service ratio are J.P. Morgan Asset Management forecasts. **Taken from the Monthly Interest Rate Survey for 15-year and 30-year fixed mortgages. ***Revolving includes credit cards. Guide to the Markets - UK. Data as of 31 December 2016. 28
 Guide to the Markets Page 27 Page 29