
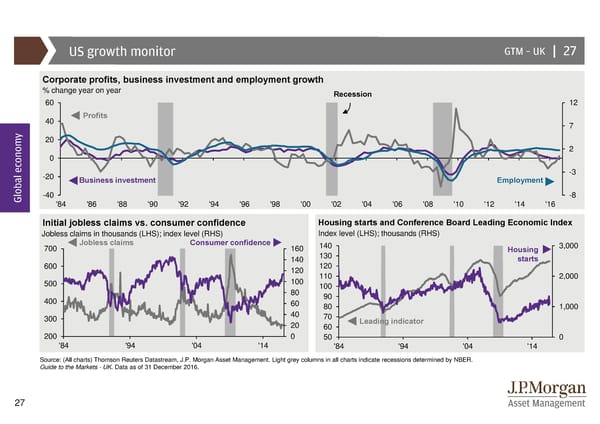
US growth monitor GTM –UK | 27 Corporate profits, business investment and employment growth % change year on year Recession 60 12 40 Profits y 7 20 2 0 -20 -3 Business investment Employment Global econom-40 -8 '84 '86 '88 '90 '92 '94 '96 '98 '00 '02 '04 '06 '08 '10 '12 '14 '16 Initial jobless claims vs. consumer confidence Housing starts and Conference Board Leading Economic Index Jobless claims in thousands (LHS); index level (RHS) Index level (LHS); thousands (RHS) 700 Jobless claims Consumer confidence 160 140 Housing 3,000 140 130 starts 600 120 120 500 100 110 2,000 80 100 400 60 90 40 80 1,000 300 70 Leading indicator 20 60 200 0 50 0 '84 '94 '04 '14 '84 '94 '04 '14 Source: (All charts) Thomson Reuters Datastream, J.P. Morgan Asset Management. Light grey columns in all charts indicate recessions determined by NBER. Guide to the Markets - UK. Data as of 31 December 2016. 27
 Guide to the Markets Page 26 Page 28