
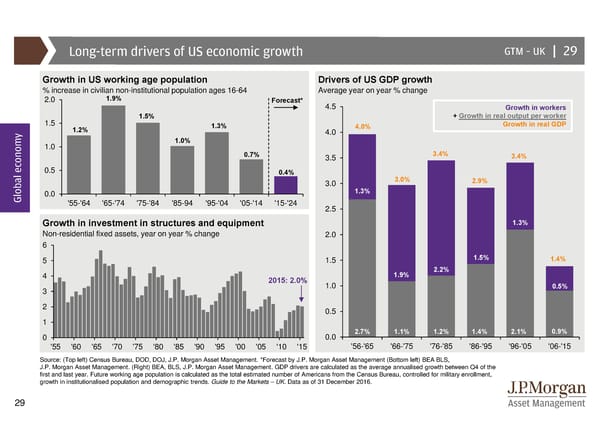
Long-term drivers of US economic growth GTM –UK | 29 Growth in US working age population Drivers of US GDP growth % increase in civilian non-institutional population ages 16-64 Average year on year % change 2.0 1.9% Forecast* 4.5 Growth in workers 1.5 1.5% + Growth in real output per worker y 1.2% 1.3% 4.0 4.0% Growth in real GDP 1.0 1.0% 0.7% 3.5 3.4% 3.4% 0.5 0.4% 3.0 3.0% 2.9% Global econom0.0 1.3% '55-'64 '65-'74 '75-'84 '85-94 '95-'04 '05-'14 '15-'24 2.5 Growth in investment in structures and equipment 1.3% Non-residential fixed assets, year on year % change 2.0 6 5 1.5 1.5% 1.4% 4 1.9% 2.2% 2015: 2.0% 1.0 0.5% 3 2 0.5 1 0 0.0 2.7% 1.1% 1.2% 1.4% 2.1% 0.9% '55 '60 '65 '70 '75 '80 '85 '90 '95 '00 '05 '10 '15 '56-'65 '66-'75 '76-'85 '86-'95 '96-'05 '06-'15 Source: (Top left) Census Bureau, DOD, DOJ, J.P. Morgan Asset Management. *Forecast by J.P. Morgan Asset Management (Bottom left) BEA BLS, J.P. Morgan Asset Management. (Right) BEA, BLS, J.P. Morgan Asset Management. GDP drivers are calculated as the average annualised growth between Q4 of the first and last year. Future working age population is calculated as the total estimated number of Americans from the Census Bureau, controlled for military enrollment, growth in institutionalised population and demographic trends. Guide to the Markets – UK. Data as of 31 December 2016. 29
 Guide to the Markets Page 28 Page 30