
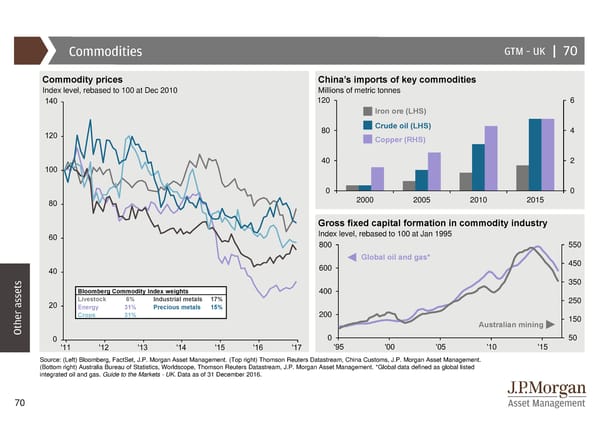
Commodities GTM –UK | 70 Commodity prices China’s imports of key commodities Index level, rebased to 100 at Dec 2010 Millions of metric tonnes 120 6 Iron ore (LHS) 80 Crude oil (LHS) 4 Copper (RHS) 40 2 0 0 2000 2005 2010 2015 Gross fixed capital formation in commodity industry Index level, rebased to 100 at Jan 1995 800 550 Global oil and gas* 450 600 350 Bloomberg Commodity Index weights 400 Livestock 6% Industrial metals 17% 250 Energy 31% Precious metals 15% 200 Crops 31% 150 Other assets Australian mining 0 50 '95 '00 '05 '10 '15 Source: (Left) Bloomberg, FactSet, J.P. Morgan Asset Management. (Top right) Thomson Reuters Datastream, China Customs, J.P. Morgan Asset Management. (Bottom right) Australia Bureau of Statistics, Worldscope, Thomson Reuters Datastream, J.P. Morgan Asset Management. *Global data defined as global listed integrated oil and gas. Guide to the Markets - UK. Data as of 31 December 2016. 70
 Guide to the Markets Page 69 Page 71