
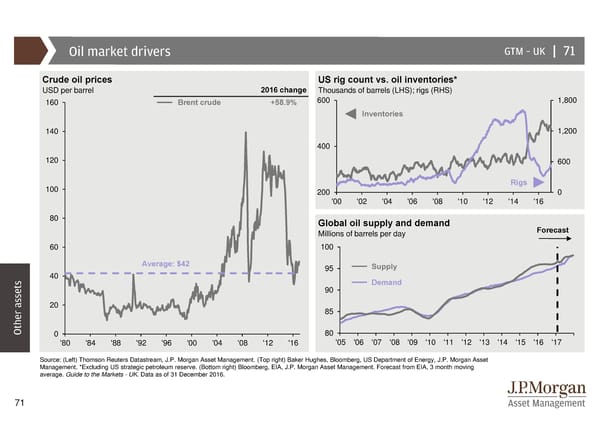
Oil market drivers GTM –UK | 71 Crude oil prices US rig count vs. oil inventories* USD per barrel 2016 change Thousands of barrels (LHS); rigs (RHS) 160 Brent crude +58.9% 600 1,800 Inventories 140 1,200 400 120 600 100 Rigs 200 0 '00 '02 '04 '06 '08 '10 '12 '14 '16 80 Global oil supply and demand Millions of barrels per day Forecast 60 100 Average: $42 95 Supply 40 Demand 90 20 85 Other assets0 80 '80 '84 '88 '92 '96 '00 '04 '08 '12 '16 '05 '06 '07 '08 '09 '10 '11 '12 '13 '14 '15 '16 '17 Source: (Left) Thomson Reuters Datastream, J.P. Morgan Asset Management. (Top right) Baker Hughes, Bloomberg, US Department of Energy, J.P. Morgan Asset Management. *Excluding US strategic petroleum reserve. (Bottom right) Bloomberg, EIA, J.P. Morgan Asset Management. Forecast from EIA, 3 month moving average. Guide to the Markets - UK. Data as of 31 December 2016. 71
 Guide to the Markets Page 70 Page 72