
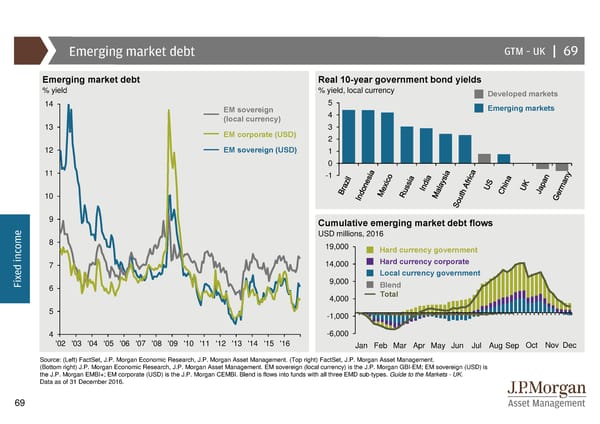
Emerging market debt GTM –UK | 69 Emerging market debt Real 10-year government bond yields % yield % yield, local currency Developed markets 14 EM sovereign 5 Emerging markets (local currency) 4 13 3 EM corporate (USD) 2 12 EM sovereign (USD) 1 0 11 -1 10 9 Cumulative emerging market debt flows e USD millions, 2016 m 8 o 19,000 Hard currency government c n Hard currency corporate i 7 14,000 d e Local currency government x 9,000 Fi 6 Blend 4,000 Total 5 -1,000 4 -6,000 '02 '03 '04 '05 '06 '07 '08 '09 '10 '11 '12 '13 '14 '15 '16 Jan Feb Mar Apr May Jun Jul Aug Sep Oct Nov Dec Source: (Left) FactSet, J.P. Morgan Economic Research, J.P. Morgan Asset Management. (Top right) FactSet, J.P. Morgan Asset Management. (Bottom right) J.P. Morgan Economic Research, J.P. Morgan Asset Management. EM sovereign (local currency) is the J.P. Morgan GBI-EM; EM sovereign (USD) is the J.P. Morgan EMBI+; EM corporate (USD) is the J.P. Morgan CEMBI. Blend is flows into funds with all three EMD sub-types. Guide to the Markets - UK. Data as of 31 December 2016. 69
 Guide to the Markets Page 68 Page 70