
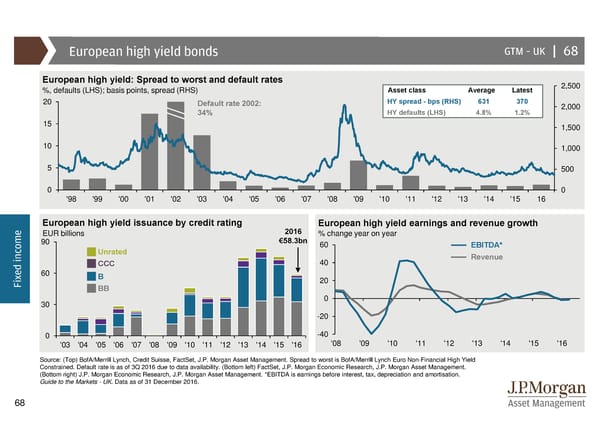
European high yield bonds GTM –UK | 68 European high yield: Spread to worst and default rates 2,500 %, defaults (LHS); basis points, spread (RHS) Asset class Average Latest 20 Default rate 2002: HY spread - bps (RHS) 631 370 2,000 34% HY defaults (LHS) 4.8% 1.2% 15 1,500 10 1,000 5 500 0 0 '98 '99 '00 '01 '02 '03 '04 '05 '06 '07 '08 '09 '10 '11 '12 '13 '14 '15 16 European high yield issuance by credit rating European high yield earnings and revenue growth e EUR billions 2016 % change year on year m 90 €58.3bn 60 EBITDA* o c Unrated n Revenue i CCC 40 d e 60 B x 20 Fi BB 30 0 -20 0 -40 '03 '04 '05 '06 '07 '08 '09 '10 '11 '12 '13 '14 '15 '16 '08 '09 '10 '11 '12 '13 '14 '15 '16 Source: (Top) BofA/Merrill Lynch, Credit Suisse, FactSet, J.P. Morgan Asset Management. Spread to worst is BofA/Merrill Lynch Euro Non-Financial High Yield Constrained. Default rate is as of 3Q 2016 due to data availability. (Bottom left) FactSet, J.P. Morgan Economic Research, J.P. Morgan Asset Management. (Bottom right) J.P. Morgan Economic Research, J.P. Morgan Asset Management. *EBITDA is earnings before interest, tax, depreciation and amortisation. Guide to the Markets - UK. Data as of 31 December 2016. 68
 Guide to the Markets Page 67 Page 69