
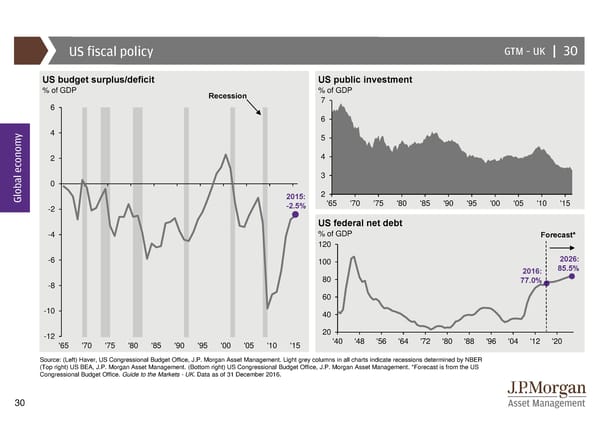
US fiscal policy GTM –UK | 30 US budget surplus/deficit US public investment % of GDP Recession % of GDP 6 7 6 y 4 5 2 4 3 0 Global econom 2015: 2 -2 -2.5% '65 '70 '75 '80 '85 '90 '95 '00 '05 '10 '15 US federal net debt -4 % of GDP Forecast* 120 -6 100 2026: 2016: 85.5% -8 80 77.0% 60 -10 40 -12 20 '65 '70 '75 '80 '85 '90 '95 '00 '05 '10 '15 '40 '48 '56 '64 '72 '80 '88 '96 '04 '12 '20 Source: (Left) Haver, US Congressional Budget Office, J.P. Morgan Asset Management. Light grey columns in all charts indicate recessions determined by NBER (Top right) US BEA, J.P. Morgan Asset Management. (Bottom right) US Congressional Budget Office, J.P. Morgan Asset Management. *Forecast is from the US Congressional Budget Office. Guide to the Markets - UK. Data as of 31 December 2016. 30
 Guide to the Markets Page 29 Page 31