
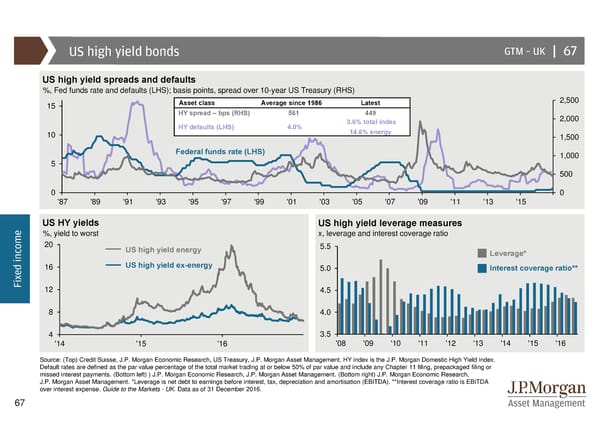
US high yield bonds GTM –UK | 67 US high yield spreads and defaults %, Fed funds rate and defaults (LHS); basis points, spread over 10-year US Treasury (RHS) 15 Asset class Average since 1986 Latest 2,500 HY spread – bps (RHS) 561 449 2,000 HY defaults (LHS) 4.0% 3.6% total index 10 14.6% energy 1,500 Federal funds rate (LHS) 1,000 5 500 0 0 '87 '89 '91 '93 '95 '97 '99 '01 '03 '05 '07 '09 '11 '13 '15 e US HY yields US high yield leverage measures m %, yield to worst x, leverage and interest coverage ratio o 20 US high yield energy 5.5 c Leverage* n i 16 US high yield ex-energy d 5.0 Interest coverage ratio** e x Fi 12 4.5 8 4.0 4 3.5 '14 '15 '16 '08 '09 '10 '11 '12 '13 '14 '15 '16 Source: (Top) Credit Suisse, J.P. Morgan Economic Research, US Treasury, J.P. Morgan Asset Management. HY index is the J.P. Morgan Domestic High Yield index. Default rates are defined as the par value percentage of the total market trading at or below 50% of par value and include any Chapter 11 filing, prepackaged filing or missed interest payments. (Bottom left) ) J.P. Morgan Economic Research, J.P. Morgan Asset Management. (Bottom right) J.P. Morgan Economic Research, J.P. Morgan Asset Management. *Leverage is net debt to earnings before interest, tax, depreciation and amortisation (EBITDA). **Interest coverage ratio is EBITDA over interest expense. Guide to the Markets - UK. Data as of 31 December 2016. 67
 Guide to the Markets Page 66 Page 68