
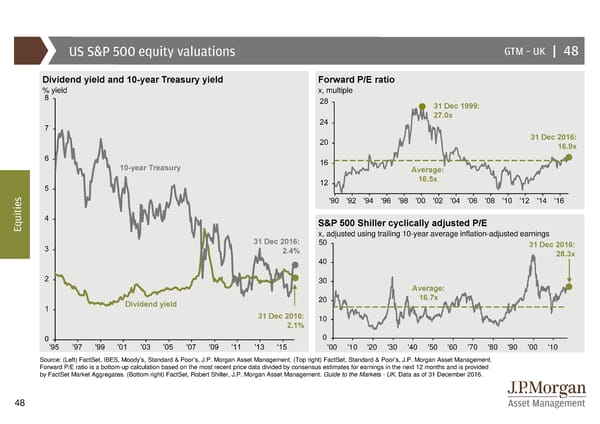
US S&P 500 equity valuations GTM –UK | 48 Dividend yield and 10-year Treasury yield Forward P/E ratio % yield x, multiple 31 Dec 1999: 27.0x 31 Dec 2016: 16.9x 10-year Treasury Average: 16.5x s e i t i u S&P 500 Shiller cyclically adjusted P/E Eq x, adjusted using trailing 10-year average inflation-adjusted earnings 31 Dec 2016: 50 31 Dec 2016: 2.4% 28.3x 40 30 Average: Dividend yield 20 16.7x 31 Dec 2016: 10 2.1% 0 '00 '10 '20 '30 '40 '50 '60 '70 '80 '90 '00 '10 Source: (Left) FactSet, IBES, Moody’s, Standard & Poor’s, J.P. Morgan Asset Management. (Top right) FactSet, Standard & Poor’s, J.P. Morgan Asset Management. Forward P/E ratio is a bottom-up calculation based on the most recent price data divided by consensus estimates for earnings in the next 12 months and is provided by FactSet Market Aggregates. (Bottom right) FactSet, Robert Shiller, J.P. Morgan Asset Management. Guide to the Markets - UK. Data as of 31 December 2016. 48
 Guide to the Markets Page 47 Page 49