
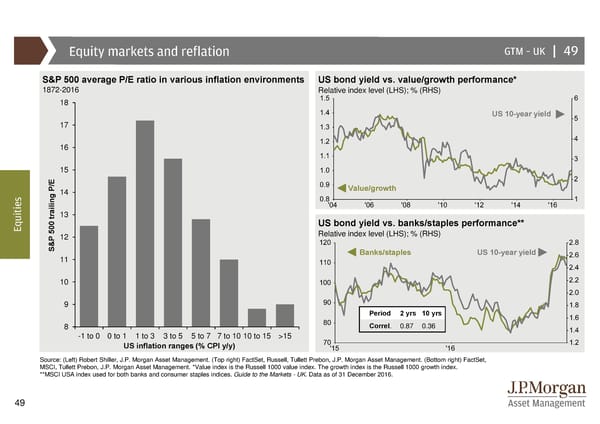
Equity markets and reflation GTM –UK | 49 S&P 500 average P/E ratio in various inflation environments US bond yield vs. value/growth performance* 1872-2016 Relative index level (LHS); % (RHS) 18 US 10-year yield 17 16 15 s 14 Value/growth e i t i trailing P/E13 u US bond yield vs. banks/staples performance** Eq Relative index level (LHS); % (RHS) S&P 500 12 11 Banks/staples US 10-year yield 10 9 Period 2 yrs 10 yrs 8 Correl. 0.87 0.36 -1 to 0 0 to 1 1 to 3 3 to 5 5 to 7 7 to 10 10 to 15 >15 US inflation ranges (% CPI y/y) Source: (Left) Robert Shiller, J.P. Morgan Asset Management. (Top right) FactSet, Russell, Tullett Prebon, J.P. Morgan Asset Management. (Bottom right) FactSet, MSCI, Tullett Prebon, J.P. Morgan Asset Management. *Value index is the Russell 1000 value index. The growth index is the Russell 1000 growth index. **MSCI USA index used for both banks and consumer staples indices. Guide to the Markets - UK. Data as of 31 December 2016. 49
 Guide to the Markets Page 48 Page 50