
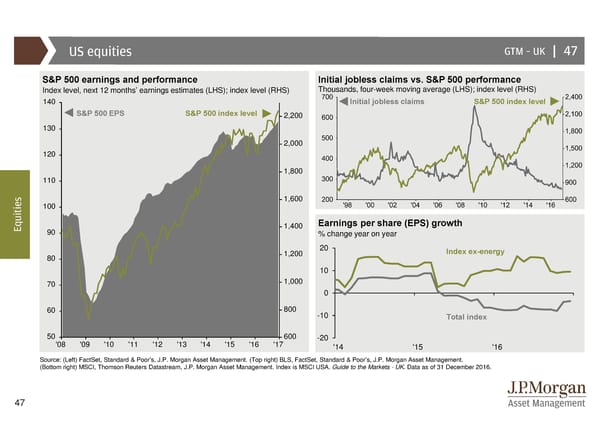
US equities GTM –UK | 47 S&P 500 earnings and performance Initial jobless claims vs. S&P 500 performance Index level, next 12 months’ earnings estimates (LHS); index level (RHS) Thousands, four-week moving average (LHS); index level (RHS) 140 Initial jobless claims S&P 500 index level S&P 500 EPS S&P 500 index level 2,200 130 2,000 120 1,800 110 s 1,600 e 100 i t i u Earnings per share (EPS) growth Eq 90 1,400 % change year on year 1,200 20 Index ex-energy 80 10 70 1,000 0 60 800 -10 Total index 50 600 -20 '08 '09 '10 '11 '12 '13 '14 '15 '16 '17 '14 '15 '16 Source: (Left) FactSet, Standard & Poor’s, J.P. Morgan Asset Management. (Top right) BLS, FactSet, Standard & Poor’s, J.P. Morgan Asset Management. (Bottom right) MSCI, Thomson Reuters Datastream, J.P. Morgan Asset Management. Index is MSCI USA. Guide to the Markets - UK. Data as of 31 December 2016. 47
 Guide to the Markets Page 46 Page 48