
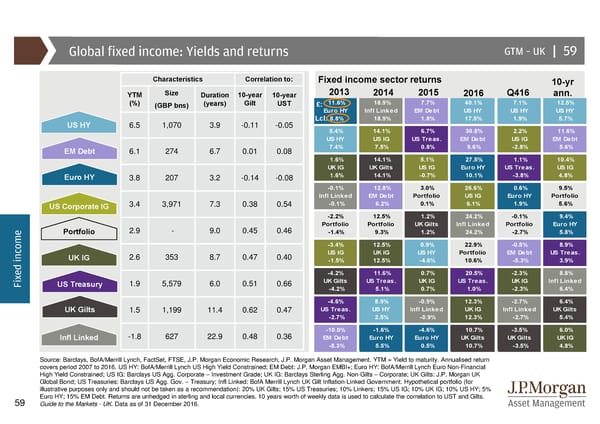
Global fixed income: Yields and returns GTM –UK || 59 Characteristics Correlation to: Fixed income sector returns 10-yr YTM Size Duration 10-year 10-year 2013 2014 2015 2016 Q416 ann. (%) (GBP bns) (years) Gilt UST £: 11.6% 18.9% 7.7% 40.1% 7.1% 12.5% Euro HY Infl Linked EM Debt US HY US HY US HY US HY 6.5 1,070 3.9 -0.11 -0.05 Lcl: 8.8% 18.9% 1.8% 17.5% 1.9% 5.7% 5.4% 14.1% 6.7% 30.8% 2.2% 11.6% US HY US IG US Treas. EM Debt US IG EM Debt EM Debt 6.1 274 6.7 0.01 0.08 7.4% 7.5% 0.8% 9.6% -2.8% 5.6% 1.6% 14.1% 5.1% 27.5% 1.1% 10.4% UK IG UK Gilts US IG Euro HY US Treas. US IG Euro HY 3.8 207 3.2 -0.14 -0.08 1.6% 14.1% -0.7% 10.1% -3.8% 4.8% -0.1% 12.8% 3.0% 26.6% 0.6% 9.5% Infl Linked EM Debt Portfolio US IG Euro HY Portfolio US Corporate IG 3.4 3,971 7.3 0.38 0.54 -0.1% 6.2% 0.1% 6.1% 1.9% 5.6% -2.2% 12.5% 1.2% 24.2% -0.1% 9.4% 2.9 - 9.0 0.45 0.46 Portfolio Portfolio UK Gilts Infl Linked Portfolio Euro HY e Portfolio -1.4% 9.3% 1.2% 24.2% -2.7% 5.8% m -3.4% 12.5% 0.9% 22.9% -0.5% 8.9% o c US IG UK IG US HY Portfolio EM Debt US Treas. n UK IG 2.6 353 8.7 0.47 0.40 i -1.5% 12.5% -4.6% 10.6% -5.3% 3.9% d e -4.2% 11.6% 0.7% 20.5% -2.3% 8.8% x UK Gilts US Treas. UK IG US Treas. UK IG Infl Linked Fi US Treasury 1.9 5,579 6.0 0.51 0.66 -4.2% 5.1% 0.7% 1.0% -2.3% 6.4% -4.6% 8.9% -0.9% 12.3% -2.7% 6.4% UK Gilts 1.5 1,199 11.4 0.62 0.47 US Treas. US HY Infl Linked UK IG Infl Linked UK Gilts -2.7% 2.5% -0.9% 12.3% -2.7% 5.4% -1.8 627 22.9 0.48 0.36 -10.0% -1.6% -4.6% 10.7% -3.5% 6.0% Infl Linked EM Debt Euro HY Euro HY UK Gilts UK Gilts UK IG -8.3% 5.5% 0.5% 10.7% -3.5% 4.8% Source: Barclays, BofA/Merrill Lynch, FactSet, FTSE, J.P. Morgan Economic Research, J.P. Morgan Asset Management. YTM = Yield to maturity. Annualised return covers period 2007 to 2016. US HY: BofA/Merrill Lynch US High Yield Constrained; EM Debt: J.P. Morgan EMBI+; Euro HY: BofA/Merrill Lynch Euro Non-Financial High Yield Constrained; US IG: Barclays US Agg. Corporate – Investment Grade; UK IG: Barclays Sterling Agg. Non-Gilts – Corporate; UK Gilts: J.P. Morgan UK Global Bond; US Treasuries: Barclays US Agg. Gov. – Treasury; Infl Linked: BofA Merrill Lynch UK Gilt Inflation-Linked Government. Hypothetical portfolio (for illustrative purposes only and should not be taken as a recommendation): 20% UK Gilts; 15% US Treasuries; 10% Linkers; 15% US IG; 10% UK IG; 10% US HY; 5% Euro HY; 15% EM Debt. Returns are unhedged in sterling and local currencies. 10 years worth of weekly data is used to calculate the correlation to UST and Gilts. 59 Guide to the Markets - UK. Data as of 31 December 2016.
 Guide to the Markets Page 58 Page 60