
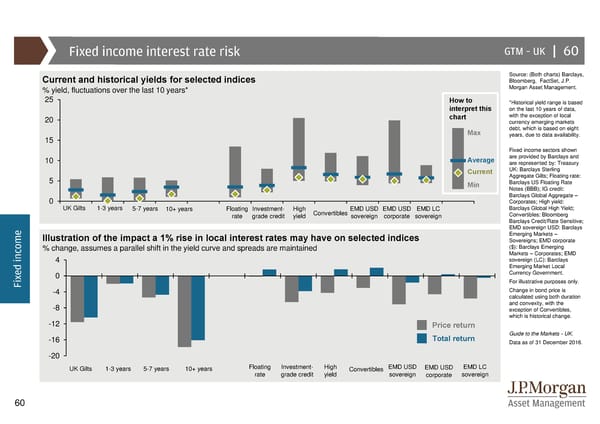
Fixed income interest rate risk GTM –UK | 60 Source: (Both charts) Barclays, Current and historical yields for selected indices Bloomberg, FactSet, J.P. % yield, fluctuations over the last 10 years* Morgan Asset Management. 25 How to *Historical yield range is based interpret this on the last 10 years of data, 20 chart with the exception of local currency emerging markets Max debt, which is based on eight 15 years, due to data availability. Fixed income sectors shown 10 Average are provided by Barclays and are represented by: Treasury Current UK: Barclays Sterling 5 Aggregate Gilts; Floating rate: Min Barclays US Floating Rate Notes (BBB); IG credit: Barclays Global Aggregate – 0 Corporates; High yield: UK Gilts 1-3 years 5-7 years 10+ years Floating Investment- High Convertibles EMD USD EMD USD EMD LC Barclays Global High Yield; rate grade credit yield sovereign corporate sovereign Convertibles: Bloomberg Barclays Credit/Rate Sensitive; e EMD sovereign USD: Barclays Illustration of the impact a 1% rise in local interest rates may have on selected indices Emerging Markets – m Sovereigns; EMD corporate o % change, assumes a parallel shift in the yield curve and spreads are maintained ($): Barclays Emerging c Markets – Corporates; EMD n 4 sovereign (LC): Barclays i d Emerging Market Local e 0 Currency Government. x Fi For illustrative purposes only. -4 Change in bond price is calculated using both duration -8 and convexity, with the exception of Convertibles, which is historical change. -12 Price return -16 Total return Guide to the Markets - UK. Data as of 31 December 2016. -20 UK Gilts 1-3 years 5-7 years 10+ years Floating Investment- High Convertibles EMD USD EMD USD EMD LC rate grade credit yield sovereign corporate sovereign 60
 Guide to the Markets Page 59 Page 61