
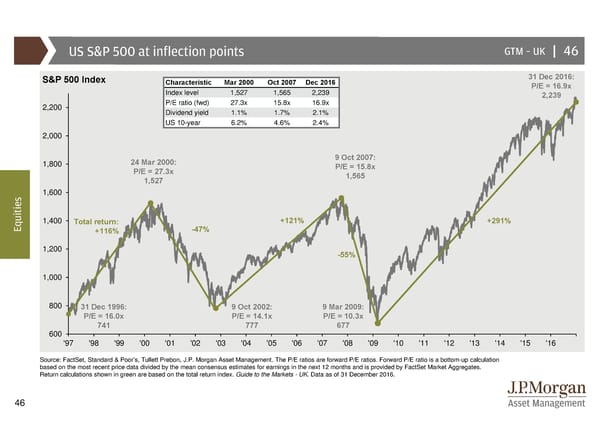
US S&P 500 at inflection points GTM –UK | 46 S&P 500 Index Characteristic Mar 2000 Oct 2007 Dec 2016 31 Dec 2016: Index level 1,527 1,565 2,239 P/E = 16.9x P/E ratio (fwd) 27.3x 15.8x 16.9x 2,239 2,200 Dividend yield 1.1% 1.7% 2.1% US 10-year 6.2% 4.6% 2.4% 2,000 1,800 24 Mar 2000: 9 Oct 2007: P/E = 27.3x P/E = 15.8x 1,527 1,565 s 1,600 e i t i u 1,400 Total return: +121% +291% Eq +116% -47% 1,200 -55% 1,000 800 31 Dec 1996: 9 Oct 2002: 9 Mar 2009: P/E = 16.0x P/E = 14.1x P/E = 10.3x 741 777 677 600 '97 '98 '99 '00 '01 '02 '03 '04 '05 '06 '07 '08 '09 '10 '11 '12 '13 '14 '15 '16 Source: FactSet, Standard & Poor’s, Tullett Prebon, J.P. Morgan Asset Management. The P/E ratios are forward P/E ratios. Forward P/E ratio is a bottom-up calculation based on the most recent price data divided by the mean consensus estimates for earnings in the next 12 months and is provided by FactSet Market Aggregates. Return calculations shown in green are based on the total return index. Guide to the Markets - UK. Data as of 31 December 2016. 46
 Guide to the Markets Page 45 Page 47