
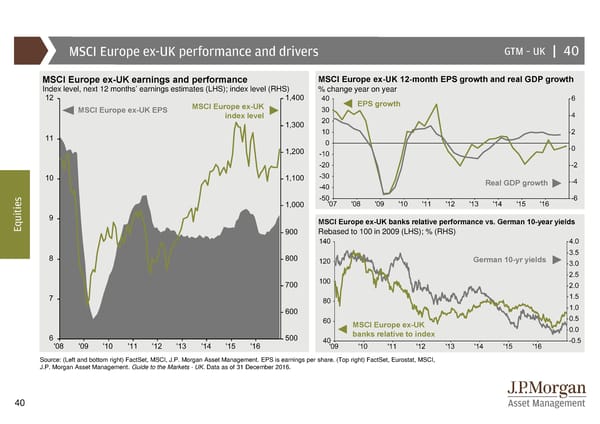
MSCI Europe ex-UK performance and drivers GTM –UK | 40 MSCI Europe ex-UK earnings and performance MSCI Europe ex-UK 12-month EPS growth and real GDP growth Index level, next 12 months’ earnings estimates (LHS); index level (RHS) % change year on year MSCI Europe ex-UK EPS MSCI Europe ex-UK EPS growth index level Real GDP growth s e i t i u MSCI Europe ex-UK banks relative performance vs. German 10-year yields Eq Rebased to 100 in 2009 (LHS); % (RHS) German 10-yr yields MSCI Europe ex-UK banks relative to index Source: (Left and bottom right) FactSet, MSCI, J.P. Morgan Asset Management. EPS is earnings per share. (Top right) FactSet, Eurostat, MSCI, J.P. Morgan Asset Management. Guide to the Markets - UK. Data as of 31 December 2016. 40
 Guide to the Markets Page 39 Page 41