
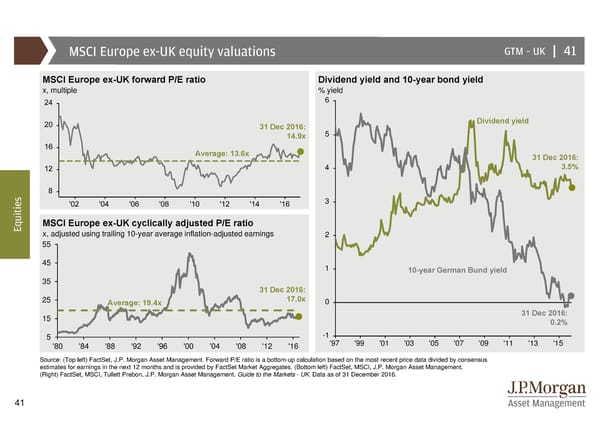
MSCI Europe ex-UK equity valuations GTM –UK | 41 MSCI Europe ex-UK forward P/E ratio Dividend yield and 10-year bond yield x, multiple % yield 6 31 Dec 2016: Dividend yield 14.9x 5 Average: 13.6x 31 Dec 2016: 4 3.5% s 3 e i t i u MSCI Europe ex-UK cyclically adjusted P/E ratio Eq x, adjusted using trailing 10-year average inflation-adjusted earnings 2 55 45 1 10-year German Bund yield 35 31 Dec 2016: 25 Average: 19.4x 17.0x 0 15 31 Dec 2016: 0.2% 5 -1 '80 '84 '88 '92 '96 '00 '04 '08 '12 '16 '97 '99 '01 '03 '05 '07 '09 '11 '13 '15 Source: (Top left) FactSet, J.P. Morgan Asset Management. Forward P/E ratio is a bottom-up calculation based on the most recent price data divided by consensus estimates for earnings in the next 12 months and is provided by FactSet Market Aggregates. (Bottom left) FactSet, MSCI, J.P. Morgan Asset Management. (Right) FactSet, MSCI, Tullett Prebon, J.P. Morgan Asset Management. Guide to the Markets - UK. Data as of 31 December 2016. 41
 Guide to the Markets Page 40 Page 42