
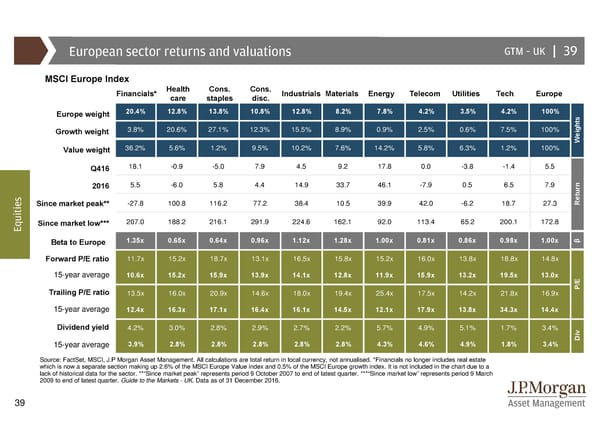
European sector returns and valuations GTM–UK | 39 MSCI Europe Index Financials* Health Cons. Cons. Industrials Materials Energy Telecom Utilities Tech Europe care staples disc. Europe weight 20.4% 12.8% 13.8% 10.8% 12.8% 8.2% 7.8% 4.2% 3.5% 4.2% 100% s t h 3.8% 20.6% 27.1% 12.3% 15.5% 8.9% 0.9% 2.5% 0.6% 7.5% 100% g Growth weight i We Value weight 36.2% 5.6% 1.2% 9.5% 10.2% 7.6% 14.2% 5.8% 6.3% 1.2% 100% Q416 18.1 -0.9 -5.0 7.9 4.5 9.2 17.8 0.0 -3.8 -1.4 5.5 2016 5.5 -6.0 5.8 4.4 14.9 33.7 46.1 -7.9 0.5 6.5 7.9 n r u s t e Since market peak** -27.8 100.8 116.2 77.2 38.4 10.5 39.9 42.0 -6.2 18.7 27.3 Re i t i u Since market low*** 207.0 188.2 216.1 291.9 224.6 162.1 92.0 113.4 65.2 200.1 172.8 Eq β Beta to Europe 1.35x 0.65x 0.64x 0.96x 1.12x 1.28x 1.00x 0.81x 0.86x 0.98x 1.00x Forward P/E ratio 11.7x 15.2x 18.7x 13.1x 16.5x 15.8x 15.2x 16.0x 13.8x 18.8x 14.8x 15-year average 10.6x 15.2x 15.9x 13.9x 14.1x 12.8x 11.9x 15.9x 13.2x 19.5x 13.0x E Trailing P/E ratio 13.5x 16.0x 20.9x 14.6x 18.0x 19.4x 25.4x 17.5x 14.2x 21.8x 16.9x P/ 15-year average 12.4x 16.3x 17.1x 16.4x 16.1x 14.5x 12.1x 17.9x 13.8x 34.3x 14.4x Dividend yield 4.2% 3.0% 2.8% 2.9% 2.7% 2.2% 5.7% 4.9% 5.1% 1.7% 3.4% v 15-year average 3.9% 2.8% 2.8% 2.8% 2.8% 2.8% 4.3% 4.6% 4.9% 1.8% 3.4% Di Source: FactSet, MSCI, J.P Morgan Asset Management. All calculations are total return in local currency, not annualised. *Financials no longer includes real estate which is now a separate section making up 2.6% of the MSCI Europe Value index and 0.5% of the MSCI Europe growth index. It is not included in the chart due to a lack of historical data for the sector. **“Since market peak” represents period 9 October 2007 to end of latest quarter. ***“Since market low” represents period 9 March 2009 to end of latest quarter. Guide to the Markets - UK. Data as of 31 December 2016. 39
 Guide to the Markets Page 38 Page 40