
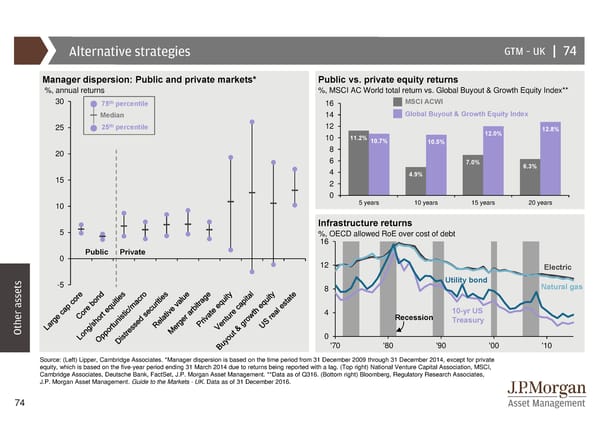
Alternative strategies GTM –UK | 74 Manager dispersion: Public and private markets* Public vs. private equity returns %, annual returns %, MSCI AC World total return vs. Global Buyout & Growth Equity Index** 30 th 16 MSCI ACWI 75 percentile Median 14 Global Buyout & Growth Equity Index 25 25th percentile 12 12.8% 10 11.2% 12.0% 10.7% 10.5% 20 8 6 7.0% 6.3% 15 4 4.9% 2 0 10 5 years 10 years 15 years 20 years Infrastructure returns 5 %, OECD allowed RoEover cost of debt 16 0 Public Private 12 Electric -5 Utility bond Natural gas 8 4 Recession 10-yr US Other assets Treasury 0 '70 '80 '90 '00 '10 Source: (Left) Lipper, Cambridge Associates. *Manager dispersion is based on the time period from 31 December 2009 through 31 December 2014, except for private equity, which is based on the five-year period ending 31 March 2014 due to returns being reported with a lag. (Top right) National Venture Capital Association, MSCI, Cambridge Associates, Deutsche Bank, FactSet, J.P. Morgan Asset Management. **Data as of Q316. (Bottom right) Bloomberg, Regulatory Research Associates, J.P. Morgan Asset Management. Guide to the Markets - UK. Data as of 31 December 2016. 74
 Guide to the Markets Page 73 Page 75