
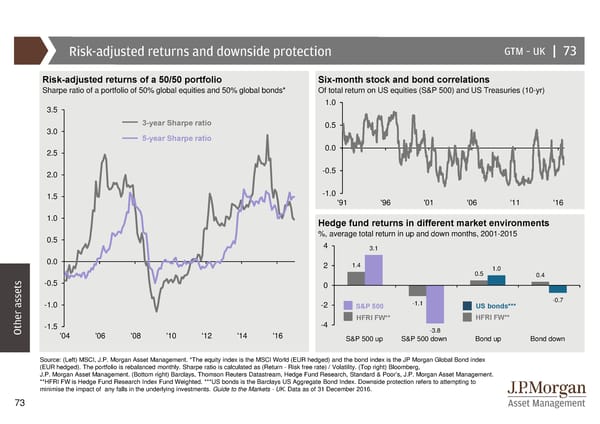
Risk-adjusted returns and downside protection GTM –UK | 73 Risk-adjusted returns of a 50/50 portfolio Six-month stock and bond correlations Sharpe ratio of a portfolio of 50% global equities and 50% global bonds* Of total return on US equities (S&P 500) and US Treasuries (10-yr) 3.5 1.0 3-year Sharpe ratio 0.5 3.0 5-year Sharpe ratio 2.5 0.0 2.0 -0.5 1.5 -1.0 '91 '96 '01 '06 '11 '16 1.0 Hedge fund returns in different market environments 0.5 %, average total return in up and down months, 2001-2015 4 3.1 0.0 2 1.4 0.5 1.0 0.4 -0.5 0 -1.0 -2 S&P 500 -1.1 US bonds*** -0.7 -4 HFRI FW** HFRI FW** Other assets-1.5 -3.8 '04 '06 '08 '10 '12 '14 '16 S&P 500 up S&P 500 down Bond up Bond down Source: (Left) MSCI, J.P. Morgan Asset Management. *The equity index is the MSCI World (EUR hedged) and the bond index is the JP Morgan Global Bond index (EUR hedged). The portfolio is rebalanced monthly. Sharpe ratio is calculated as (Return - Risk free rate) / Volatility. (Top right) Bloomberg, J.P. Morgan Asset Management. (Bottom right) Barclays, Thomson Reuters Datastream, Hedge Fund Research, Standard & Poor’s, J.P. Morgan Asset Management. **HFRI FW is Hedge Fund Research Index Fund Weighted. ***US bonds is the Barclays US Aggregate Bond Index. Downside protection refers to attempting to minimise the impact of any falls in the underlying investments. Guide to the Markets - UK. Data as of 31 December 2016. 73
 Guide to the Markets Page 72 Page 74