
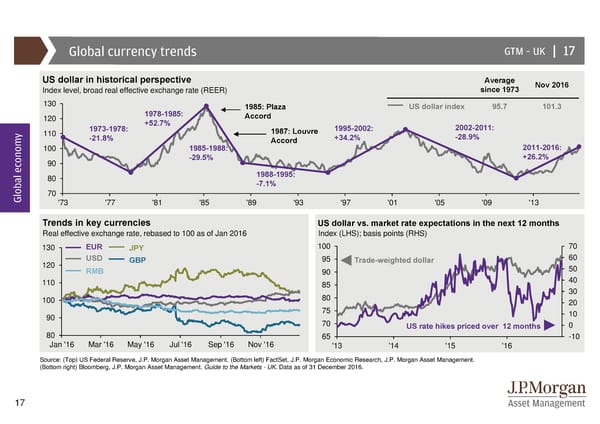
Global currency trends GTM –UK | 17 US dollar in historical perspective Average Nov 2016 Index level, broad real effective exchange rate (REER) since 1973 130 1985: Plaza US dollar index 95.7 101.3 120 1978-1985: Accord 1973-1978: +52.7% 1995-2002: 2002-2011: y 110 -21.8% 1987: Louvre +34.2% -28.9% 100 1985-1988: Accord 2011-2016: 90 -29.5% +26.2% 80 1988-1995: -7.1% Global econom70 '73 '77 '81 '85 '89 '93 '97 '01 '05 '09 '13 Trends in key currencies US dollar vs. market rate expectations in the next 12 months Real effective exchange rate, rebased to 100 as of Jan 2016 Index (LHS); basis points (RHS) 130 EUR JPY 100 70 120 USD GBP 95 Trade-weighted dollar 60 RMB 90 50 110 85 40 80 30 100 20 90 75 10 70 US rate hikes priced over 12 months 0 80 65 -10 Jan '16 Mar '16 May '16 Jul '16 Sep '16 Nov '16 '13 '14 '15 '16 Source: (Top) US Federal Reserve, J.P. Morgan Asset Management. (Bottom left) FactSet, J.P. Morgan Economic Research, J.P. Morgan Asset Management. (Bottom right) Bloomberg, J.P. Morgan Asset Management. Guide to the Markets - UK. Data as of 31 December 2016. 17
 Guide to the Markets Page 16 Page 18