
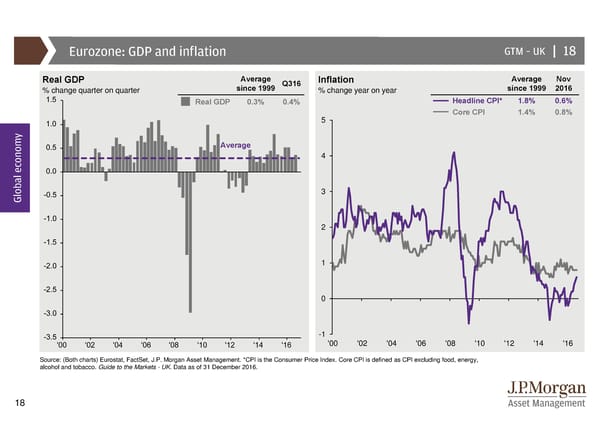
Eurozone: GDP and inflation GTM –UK | 18 Real GDP Average Q316 Inflation Average Nov % change quarter on quarter since 1999 % change year on year since 1999 2016 Real GDP 0.3% 0.4% Headline CPI* 1.8% 0.6% 5 Core CPI 1.4% 0.8% y Average 4 Global econom 3 2 1 0 -1 '00 '02 '04 '06 '08 '10 '12 '14 '16 Source: (Both charts) Eurostat, FactSet, J.P. Morgan Asset Management. *CPI is the Consumer Price Index. Core CPI is defined as CPI excluding food, energy, alcohol and tobacco. Guide to the Markets - UK. Data as of 31 December 2016. 18
 Guide to the Markets Page 17 Page 19