
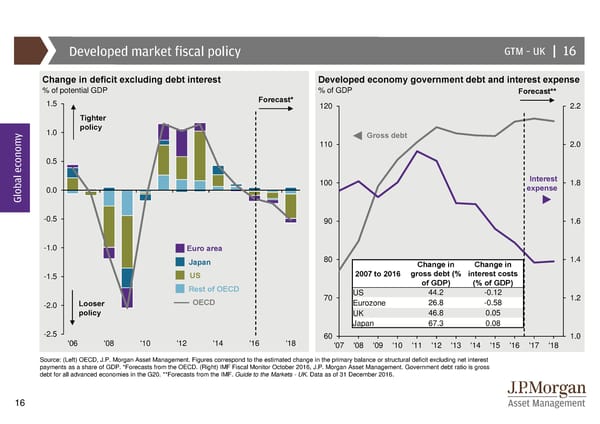
Developed market fiscal policy GTM –UK | 16 Change in deficit excluding debt interest Developed economy government debt and interest expense % of potential GDP % of GDP Forecast** 1.5 Forecast* 120 2.2 Tighter 1.0 policy y Gross debt 110 2.0 0.5 100 Interest 1.8 Global econom0.0 expense -0.5 90 1.6 -1.0 Euro area Japan 80 Change in Change in 1.4 -1.5 US 2007 to 2016 gross debt (% interest costs Rest of OECD of GDP) (% of GDP) 70 US 44.2 -0.12 1.2 -2.0 Looser OECD Eurozone 26.8 -0.58 policy UK 46.8 0.05 Japan 67.3 0.08 -2.5 60 1.0 '06 '08 '10 '12 '14 '16 '18 '07 '08 '09 '10 '11 '12 '13 '14 '15 '16 '17 '18 Source: (Left) OECD, J.P. Morgan Asset Management. Figures correspond to the estimated change in the primary balance or structural deficit excluding net interest payments as a share of GDP. *Forecasts from the OECD. (Right) IMF Fiscal Monitor October 2016, J.P. Morgan Asset Management. Government debt ratio is gross debt for all advanced economies in the G20. **Forecasts from the IMF. Guide to the Markets - UK. Data as of 31 December 2016. 16
 Guide to the Markets Page 15 Page 17