
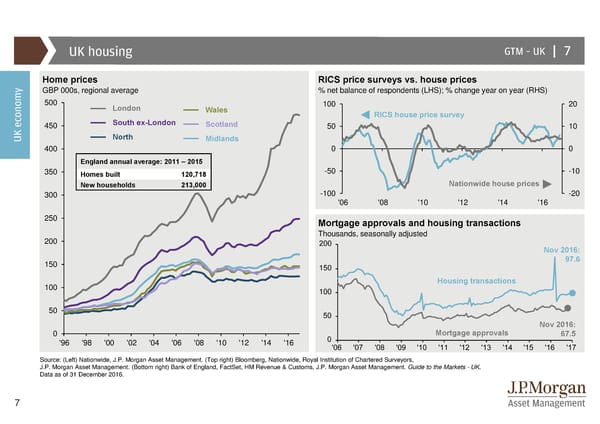
UK housing GTM –UK | 7 y Home prices RICS price surveys vs. house prices GBP 000s, regional average % net balance of respondents (LHS); % change year on year (RHS) 500 London Wales 100 20 South ex-London RICS house price survey 450 Scotland 50 10 UK econom North Midlands 400 0 0 England annual average: 2011 – 2015 350 Homes built 120,718 -50 -10 New households 213,000 Nationwide house prices 300 -100 -20 '06 '08 '10 '12 '14 '16 250 Mortgage approvals and housing transactions 200 Thousands, seasonally adjusted Nov 2016: 150 97.6 100 Housing transactions 50 Nov 2016: 0 Mortgage approvals 67.5 '96 '98 '00 '02 '04 '06 '08 '10 '12 '14 '16 Source: (Left) Nationwide, J.P. Morgan Asset Management. (Top right) Bloomberg, Nationwide, Royal Institution of Chartered Surveyors, J.P. Morgan Asset Management. (Bottom right) Bank of England, FactSet, HM Revenue & Customs, J.P. Morgan Asset Management. Guide to the Markets - UK. Data as of 31 December 2016. 7
 Guide to the Markets Page 6 Page 8