
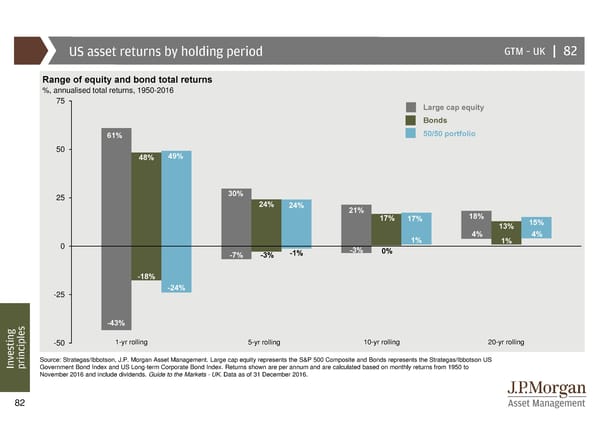
US asset returns by holding period GTM –UK | 82 Range of equity and bond total returns %, annualised total returns, 1950-2016 75 Large cap equity Bonds 61% 50/50 portfolio 50 49% 48% 25 30% 24% 24% 21% 17% 17% 18% 15% 4% 13% 4% 0 1% 1% -7% -3% -1% -3% 0% -18% -25 -24% -43% sting -50 1-yr rolling 5-yr rolling 10-yr rolling 20-yr rolling e v Source: Strategas/Ibbotson, J.P. Morgan Asset Management. Large cap equity represents the S&P 500 Composite and Bonds represents the Strategas/Ibbotson US In principlesGovernment Bond Index and US Long-term Corporate Bond Index. Returns shown are per annum and are calculated based on monthly returns from 1950 to November 2016 and include dividends. Guide to the Markets - UK. Data as of 31 December 2016. 82
 Guide to the Markets Page 81 Page 83