
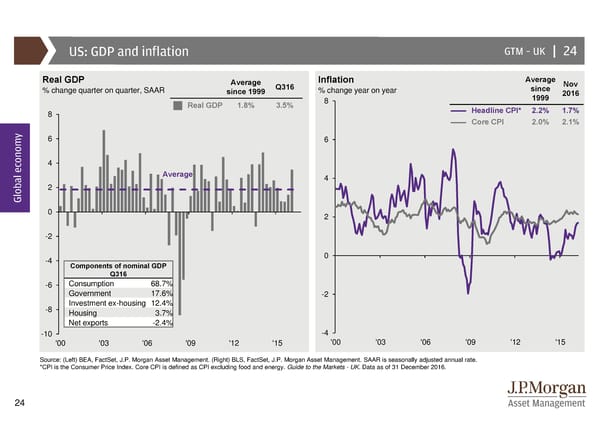
US: GDP and inflation GTM –UK | 24 Real GDP Average Q316 Inflation Average Nov % change quarter on quarter, SAAR since 1999 % change year on year since 2016 Real GDP 1.8% 3.5% 8 1999 8 HeadlineCPI* 2.2% 1.7% Core CPI 2.0% 2.1% y 6 6 4 Average 4 2 Global econom 0 2 -2 -4 0 Componentsof nominal GDP Q316 -6 Consumption 68.7% Government 17.6% -2 -8 Investment ex-housing 12.4% Housing 3.7% Net exports -2.4% -10 -4 '00 '03 '06 '09 '12 '15 '00 '03 '06 '09 '12 '15 Source: (Left) BEA, FactSet, J.P. Morgan Asset Management. (Right) BLS, FactSet, J.P. Morgan Asset Management. SAAR is seasonally adjusted annual rate. *CPI is the Consumer Price Index. Core CPI is defined as CPI excluding food and energy. Guide to the Markets - UK. Data as of 31 December 2016. 24
 Guide to the Markets Page 23 Page 25