
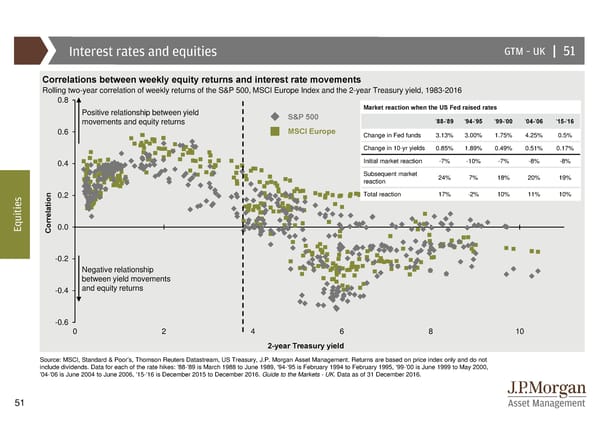
Interest rates and equities GTM –UK | 51 Correlations between weekly equity returns and interest rate movements Rolling two-year correlation of weekly returns of the S&P 500, MSCI Europe Index and the 2-year Treasury yield, 1983-2016 0.8 Positive relationship between yield Market reaction when the US Fed raised rates movements and equity returns S&P 500 '88-'89 '94-'95 '99-'00 '04-'06 '15-'16 0.6 MSCI Europe Change in Fed funds 3.13% 3.00% 1.75% 4.25% 0.5% Change in 10-yr yields 0.85% 1.89% 0.49% 0.51% 0.17% 0.4 Initial market reaction -7% -10% -7% -8% -8% Subsequent market 24% 7% 18% 20% 19% reaction s 0.2 Total reaction 17% -2% 10% 11% 10% e i t i u Eq Correlation 0.0 -0.2 Negative relationship between yield movements -0.4 and equity returns -0.6 0246810 2-year Treasury yield Source: MSCI, Standard & Poor’s, Thomson Reuters Datastream, US Treasury, J.P. Morgan Asset Management. Returns are based on price index only and do not include dividends. Data for each of the rate hikes: '88-'89 is March 1988 to June 1989, '94-'95 is February 1994 to February 1995, '99-'00 is June 1999 to May 2000, '04-'06 is June 2004 to June 2006, '15-'16 is December 2015 to December 2016. Guide to the Markets - UK. Data as of 31 December 2016. 51
 Guide to the Markets Page 50 Page 52