
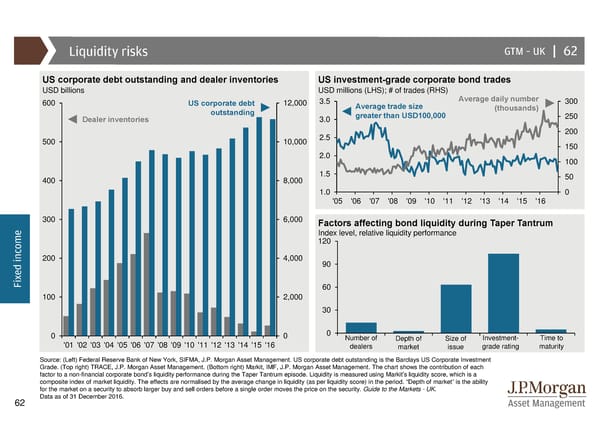
Liquidity risks GTM –UK | 62 US corporate debt outstanding and dealer inventories US investment-grade corporate bond trades USD billions USD millions (LHS); # of trades (RHS) 600 UScorporate debt 12,000 3.5 Average trade size Average daily number 300 outstanding greater than USD100,000 (thousands) 250 Dealer inventories 3.0 2.5 200 500 10,000 150 2.0 100 400 8,000 1.5 50 1.0 0 '05 '06 '07 '08 '09 '10 '11 '12 '13 '14 '15 '16 300 6,000 Factors affecting bond liquidity during Taper Tantrum e Index level, relative liquidity performance m 120 o c n 200 4,000 i 90 d e x Fi 60 100 2,000 30 0 0 0 Number of Depth of Size of Investment- Time to '01 '02 '03 '04 '05 '06 '07 '08 '09 '10 '11 '12 '13 '14 '15 '16 dealers market issue grade rating maturity Source: (Left) Federal Reserve Bank of New York, SIFMA, J.P. Morgan Asset Management. US corporate debt outstanding is the Barclays US Corporate Investment Grade. (Top right) TRACE, J.P. Morgan Asset Management. (Bottom right) Markit, IMF, J.P. Morgan Asset Management. The chart shows the contribution of each factor to a non-financial corporate bond’s liquidity performance during the Taper Tantrum episode. Liquidity is measured using Markit’s liquidity score, which is a composite index of market liquidity. The effects are normalised by the average change in liquidity (as per liquidity score) in the period. “Depth of market” is the ability for the market on a security to absorb larger buy and sell orders before a single order moves the price on the security. Guide to the Markets - UK. Data as of 31 December 2016. 62
 Guide to the Markets Page 61 Page 63