
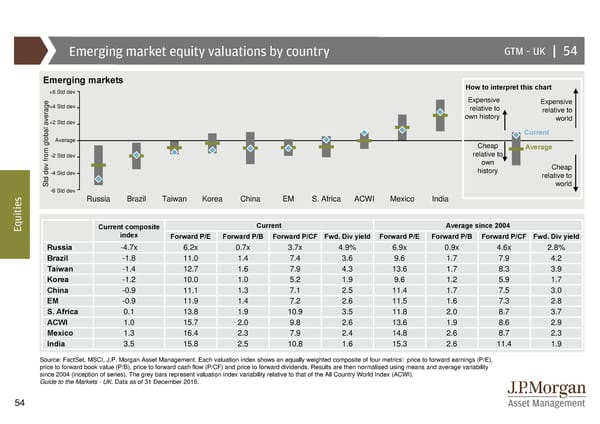
Emerging market equity valuations by country GTM –UK | 54 Emerging markets How to interpret this chart +6 Std dev Expensive Expensive +4 Std dev relative to relative to average+2 Std dev own history world Current Average Cheap relative to Average from global -2 Std dev own Cheap dev-4 Std dev history relative to Std world s -6 Std dev e Russia Brazil Taiwan Korea China EM S. Africa ACWI Mexico India i t i u Eq Current composite Current Average since 2004 index Forward P/E Forward P/B Forward P/CF Fwd. Divyield Forward P/E Forward P/B Forward P/CF Fwd. Divyield Russia -4.7x 6.2x 0.7x 3.7x 4.9% 6.9x 0.9x 4.6x 2.8% Brazil -1.8 11.0 1.4 7.4 3.6 9.6 1.7 7.9 4.2 Taiwan -1.4 12.7 1.6 7.9 4.3 13.6 1.7 8.3 3.9 Korea -1.2 10.0 1.0 5.2 1.9 9.6 1.2 5.9 1.7 China -0.9 11.1 1.3 7.1 2.5 11.4 1.7 7.5 3.0 EM -0.9 11.9 1.4 7.2 2.6 11.5 1.6 7.3 2.8 S. Africa 0.1 13.8 1.9 10.9 3.5 11.8 2.0 8.7 3.7 ACWI 1.0 15.7 2.0 9.8 2.6 13.6 1.9 8.6 2.9 Mexico 1.3 16.4 2.3 7.9 2.4 14.8 2.6 8.7 2.3 India 3.5 15.8 2.5 10.8 1.6 15.3 2.6 11.4 1.9 Source: FactSet, MSCI, J.P. Morgan Asset Management. Each valuation index shows an equally weighted composite of four metrics: price to forward earnings (P/E), price to forward book value (P/B), price to forward cash flow (P/CF) and price to forward dividends. Results are then normalised using means and average variability since 2004 (inception of series). The grey bars represent valuation index variability relative to that of the All Country World Index (ACWI). Guide to the Markets - UK. Data as of 31 December 2016. 54
 Guide to the Markets Page 53 Page 55