
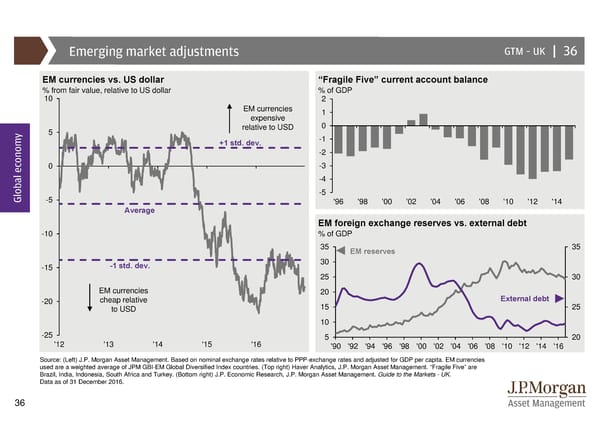
Emerging market adjustments GTM –UK | 36 EM currencies vs. US dollar “Fragile Five” current account balance % from fair value, relative to US dollar % of GDP 10 2 EM currencies 1 expensive 0 y 5 relative to USD +1 std. dev. -1 -2 0 -3 -4 Global econom-5 -5 '96 '98 '00 '02 '04 '06 '08 '10 '12 '14 Average EM foreign exchange reserves vs. external debt -10 % of GDP 35 EM reserves 35 -15 -1 std. dev. 30 25 30 EM currencies 20 -20 cheap relative 15 External debt 25 to USD 10 -25 5 20 '12 '13 '14 '15 '16 '90 '92 '94 '96 '98 '00 '02 '04 '06 '08 '10 '12 '14 '16 Source: (Left) J.P. Morgan Asset Management. Based on nominal exchange rates relative to PPP-exchange rates and adjusted for GDP per capita. EM currencies used are a weighted average of JPM GBI-EM Global Diversified Index countries. (Top right) Haver Analytics, J.P. Morgan Asset Management. “Fragile Five” are Brazil, India, Indonesia, South Africa and Turkey. (Bottom right) J.P. Economic Research, J.P. Morgan Asset Management. Guide to the Markets - UK. Data as of 31 December 2016. 36
 Guide to the Markets Page 35 Page 37