
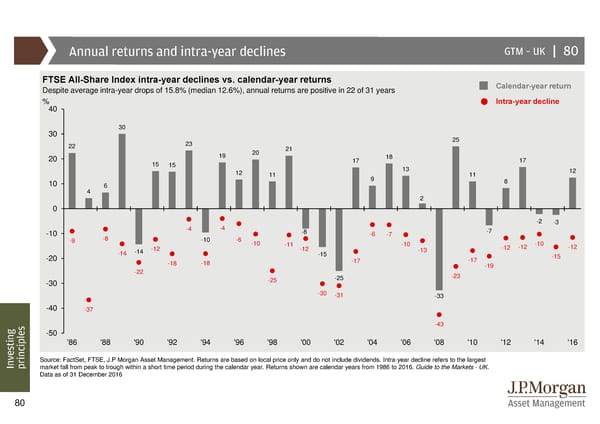
Annual returns and intra-year declines GTM –UK | 80 FTSE All-Share Index intra-year declines vs. calendar-year returns Calendar-year return Despite average intra-year drops of 15.8% (median 12.6%), annual returns are positive in 22 of 31 years % Intra-year decline 40 30 30 23 25 22 21 20 19 20 18 15 15 17 17 12 11 13 11 12 10 9 8 4 6 2 0 -2 -3 -10 -4 -4 -8 -6 -7 -9 -8 -10 -6 -7 -12 -10 -11 -12 -10 -12 -12 -10 -12 -14 -14 -15 -13 -15 -20 -18 -18 -17 -17 -22 -19 -30 -25 -25 -23 -30 -31 -33 -40 -37 -43 -50 sting '86 '88 '90 '92 '94 '96 '98 '00 '02 '04 '06 '08 '10 '12 '14 '16 e v Source: FactSet, FTSE, J.P Morgan Asset Management. Returns are based on local price only and do not include dividends. Intra-year decline refers to the largest In principlesmarket fall from peak to trough within a short time period during the calendar year. Returns shown are calendar years from 1986 to 2016. Guide to the Markets - UK. Data as of 31 December 2016 80
 Guide to the Markets Page 79 Page 81