
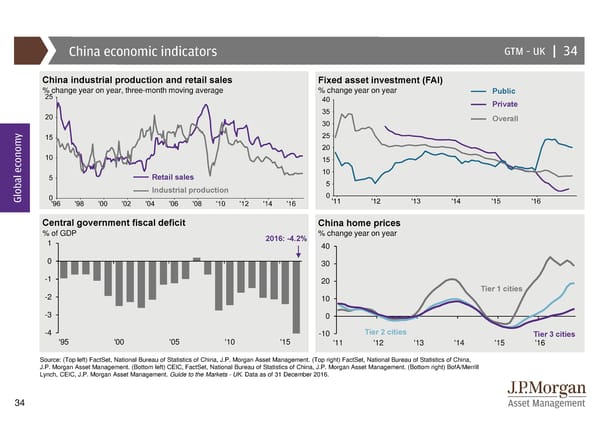
China economic indicators GTM –UK | 34 China industrial production and retail sales Fixed asset investment (FAI) % change year on year, three-month moving average % change year on year Public Private Overall y Retail sales Global econom Industrial production Central government fiscal deficit China home prices % of GDP 2016: -4.2% % change year on year 1 40 0 30 -1 20 -2 Tier 1 cities 10 -3 0 -4 -10 Tier 2 cities Tier 3 cities '95 '00 '05 '10 '15 '11 '12 '13 '14 '15 '16 Source: (Top left) FactSet, National Bureau of Statistics of China, J.P. Morgan Asset Management. (Top right) FactSet, National Bureau of Statistics of China, J.P. Morgan Asset Management. (Bottom left) CEIC, FactSet, National Bureau of Statistics of China, J.P. Morgan Asset Management. (Bottom right) BofA/Merrill Lynch, CEIC, J.P. Morgan Asset Management. Guide to the Markets - UK. Data as of 31 December 2016. 34
 Guide to the Markets Page 33 Page 35