
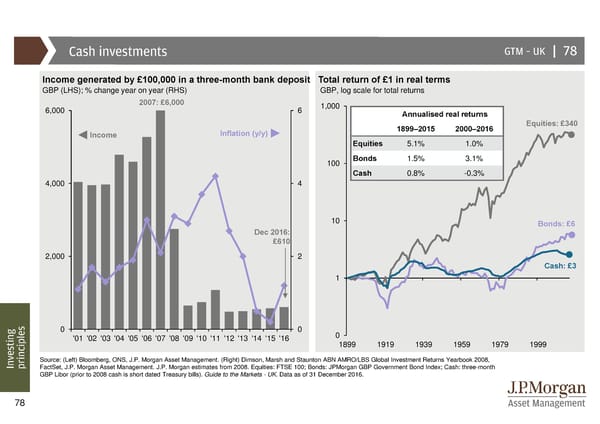
Cash investments GTM –UK | 78 Income generated by £100,000 in a three-month bank deposit Total return of £1 in real terms GBP (LHS); % change year on year (RHS) GBP, log scale for total returns 6,000 2007: £6,000 6 1,000 Annualisedreal returns 1899–2015 2000–2016 Equities: £340 Income Inflation (y/y) Equities 5.1% 1.0% 100 Bonds 1.5% 3.1% Cash 0.8% -0.3% 4,000 4 10 Bonds: £6 Dec 2016: £610 2,000 2 Cash: £3 1 0 0 0 sting '01 '02 '03 '04 '05 '06 '07 '08 '09 '10 '11 '12 '13 '14 '15 '16 1899 1919 1939 1959 1979 1999 e v Source: (Left) Bloomberg, ONS, J.P. Morgan Asset Management. (Right) Dimson, Marsh and Staunton ABN AMRO/LBS Global Investment Returns Yearbook 2008, In principlesFactSet, J.P. Morgan Asset Management. J.P. Morgan estimates from 2008. Equities: FTSE 100; Bonds: JPMorgan GBP Government Bond Index; Cash: three-month GBP Libor (prior to 2008 cash is short dated Treasury bills). Guide to the Markets - UK. Data as of 31 December 2016. 78
 Guide to the Markets Page 77 Page 79