
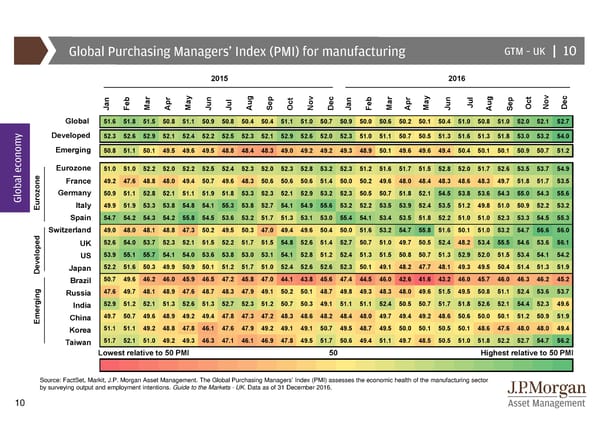
Global Purchasing Managers Index (PMI) for manufacturing GTM–UK | 10 2015 2016 Jan Feb Mar Apr May Jun Jul Aug Sep Oct Nov Dec Jan Feb Mar Apr May Jun Jul Aug Sep Oct Nov Dec Global 51.6 51.8 51.5 50.8 51.1 50.9 50.8 50.4 50.4 51.1 51.0 50.7 50.9 50.0 50.6 50.2 50.1 50.4 51.0 50.8 51.0 52.0 52.1 52.7 y Developed 52.3 52.6 52.9 52.1 52.4 52.2 52.5 52.3 52.1 52.9 52.6 52.0 52.3 51.0 51.1 50.7 50.5 51.3 51.6 51.3 51.8 53.0 53.2 54.0 Emerging 50.8 51.1 50.1 49.5 49.6 49.5 48.8 48.4 48.3 49.0 49.2 49.2 49.3 48.9 50.1 49.6 49.6 49.4 50.4 50.1 50.1 50.9 50.7 51.2 Eurozone 51.0 51.0 52.2 52.0 52.2 52.5 52.4 52.3 52.0 52.3 52.8 53.2 52.3 51.2 51.6 51.7 51.5 52.8 52.0 51.7 52.6 53.5 53.7 54.9 France 49.2 47.6 48.8 48.0 49.4 50.7 49.6 48.3 50.6 50.6 50.6 51.4 50.0 50.2 49.6 48.0 48.4 48.3 48.6 48.3 49.7 51.8 51.7 53.5 Global economGermany 50.9 51.1 52.8 52.1 51.1 51.9 51.8 53.3 52.3 52.1 52.9 53.2 52.3 50.5 50.7 51.8 52.1 54.5 53.8 53.6 54.3 55.0 54.3 55.6 Eurozone Italy 49.9 51.9 53.3 53.8 54.8 54.1 55.3 53.8 52.7 54.1 54.9 55.6 53.2 52.2 53.5 53.9 52.4 53.5 51.2 49.8 51.0 50.9 52.2 53.2 Spain 54.7 54.2 54.3 54.2 55.8 54.5 53.6 53.2 51.7 51.3 53.1 53.0 55.4 54.1 53.4 53.5 51.8 52.2 51.0 51.0 52.3 53.3 54.5 55.3 d Switzerland 49.0 48.0 48.1 48.8 47.3 50.2 49.5 50.3 47.0 49.4 49.6 50.4 50.0 51.6 53.2 54.7 55.8 51.6 50.1 51.0 53.2 54.7 56.6 56.0 UK 52.6 54.0 53.7 52.3 52.1 51.5 52.2 51.7 51.5 54.8 52.6 51.4 52.7 50.7 51.0 49.7 50.5 52.4 48.2 53.4 55.5 54.6 53.6 56.1 US 53.9 55.1 55.7 54.1 54.0 53.6 53.8 53.0 53.1 54.1 52.8 51.2 52.4 51.3 51.5 50.8 50.7 51.3 52.9 52.0 51.5 53.4 54.1 54.2 Develope Japan 52.2 51.6 50.3 49.9 50.9 50.1 51.2 51.7 51.0 52.4 52.6 52.6 52.3 50.1 49.1 48.2 47.7 48.1 49.3 49.5 50.4 51.4 51.3 51.9 Brazil 50.7 49.6 46.2 46.0 45.9 46.5 47.2 45.8 47.0 44.1 43.8 45.6 47.4 44.5 46.0 42.6 41.6 43.2 46.0 45.7 46.0 46.3 46.2 45.2 Russia 47.6 49.7 48.1 48.9 47.6 48.7 48.3 47.9 49.1 50.2 50.1 48.7 49.8 49.3 48.3 48.0 49.6 51.5 49.5 50.8 51.1 52.4 53.6 53.7 India 52.9 51.2 52.1 51.3 52.6 51.3 52.7 52.3 51.2 50.7 50.3 49.1 51.1 51.1 52.4 50.5 50.7 51.7 51.8 52.6 52.1 54.4 52.3 49.6 Emerging China 49.7 50.7 49.6 48.9 49.2 49.4 47.8 47.3 47.2 48.3 48.6 48.2 48.4 48.0 49.7 49.4 49.2 48.6 50.6 50.0 50.1 51.2 50.9 51.9 Korea 51.1 51.1 49.2 48.8 47.8 46.1 47.6 47.9 49.2 49.1 49.1 50.7 49.5 48.7 49.5 50.0 50.1 50.5 50.1 48.6 47.6 48.0 48.0 49.4 Taiwan 51.7 52.1 51.0 49.2 49.3 46.3 47.1 46.1 46.9 47.8 49.5 51.7 50.6 49.4 51.1 49.7 48.5 50.5 51.0 51.8 52.2 52.7 54.7 56.2 Lowest relative to 50 PMI 50 Highest relative to 50 PMI Source: FactSet, Markit, J.P. Morgan Asset Management. The Global Purchasing Managers’ Index (PMI) assesses the economic health of the manufacturing sector by surveying output and employment intentions. Guide to the Markets - UK. Data as of 31 December 2016. 10
 Guide to the Markets Page 9 Page 11