
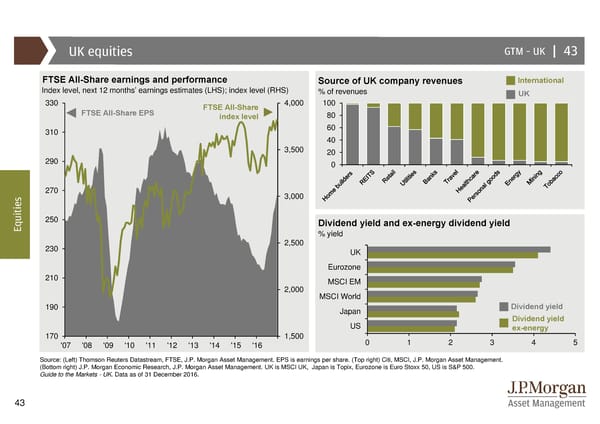
UK equities GTM –UK | 43 FTSE All-Share earnings and performance Source of UK company revenues International Index level, next 12 months’ earnings estimates (LHS); index level (RHS) % of revenues UK 330 FTSE All-Share 4,000 100 FTSE All-Share EPS index level 80 310 60 40 3,500 20 290 0 s 270 3,000 e i t i u 250 Dividend yield and ex-energy dividend yield Eq % yield 230 2,500 UK Eurozone 210 MSCI EM 2,000 MSCI World 190 Japan Dividend yield US Dividend yield 170 1,500 ex-energy '07 '08 '09 '10 '11 '12 '13 '14 '15 '16 012345 Source: (Left) Thomson Reuters Datastream, FTSE, J.P. Morgan Asset Management. EPS is earnings per share. (Top right) Citi, MSCI, J.P. Morgan Asset Management. (Bottom right) J.P. Morgan Economic Research, J.P. Morgan Asset Management. UK is MSCI UK, Japan is Topix, Eurozone is Euro Stoxx 50, US is S&P 500. Guide to the Markets - UK. Data as of 31 December 2016. 43
 Guide to the Markets Page 42 Page 44